By
By
What is Imbalanced Data
Imbalanced data is a case that is incredibly common in Machine Learning applications. Imbalanced data occurs when you have many observations in your data that represent one type of class and other classes that are much smaller. Examples of this might be fraudulent credit card transactions relative to legitimate purchases or potentially spam emails relative to legitimate emails (It's also probable that legitimate emails are the minority these days).
What is the Challenge?
The challenge you will run into with imbalanced data is around how algorithms learn off of your data. As you build a train/test dataset, the number of observations representing the minority class will be much smaller than the majority. The algorithm doesn't have enough data to truly model what the minority class will look like and ends up over-biasing to the majority class. It can be especially dangerous to use a simple Accuracy metric to evaluate your model or look for high precision or recall towards the minority class. More on evaluation metrics later.
Methods for Working with Imbalanced Data
Fortunately, with a little additional thought and set up in your training and testing phases, you can deal with imbalanced data; there are numerous ways to handle imbalanced data. The following are some (not all) of the ways you can manage it:
- Algorithm Selection
- Cross-Validation for Imbalanced Data
- Generating synthetic data
- Choosing the right performance metric
How do I Know if I Have Imbalanced Data
One simple line of code is all you need to check for imbalanced data. Take your target variable, and use the following code.
 df['Target'].value_counts()
[OUT]
1    17433
0     5193
By checking the count of items, we can quickly and easily see that there are far more of the 1 class than the 0 class.
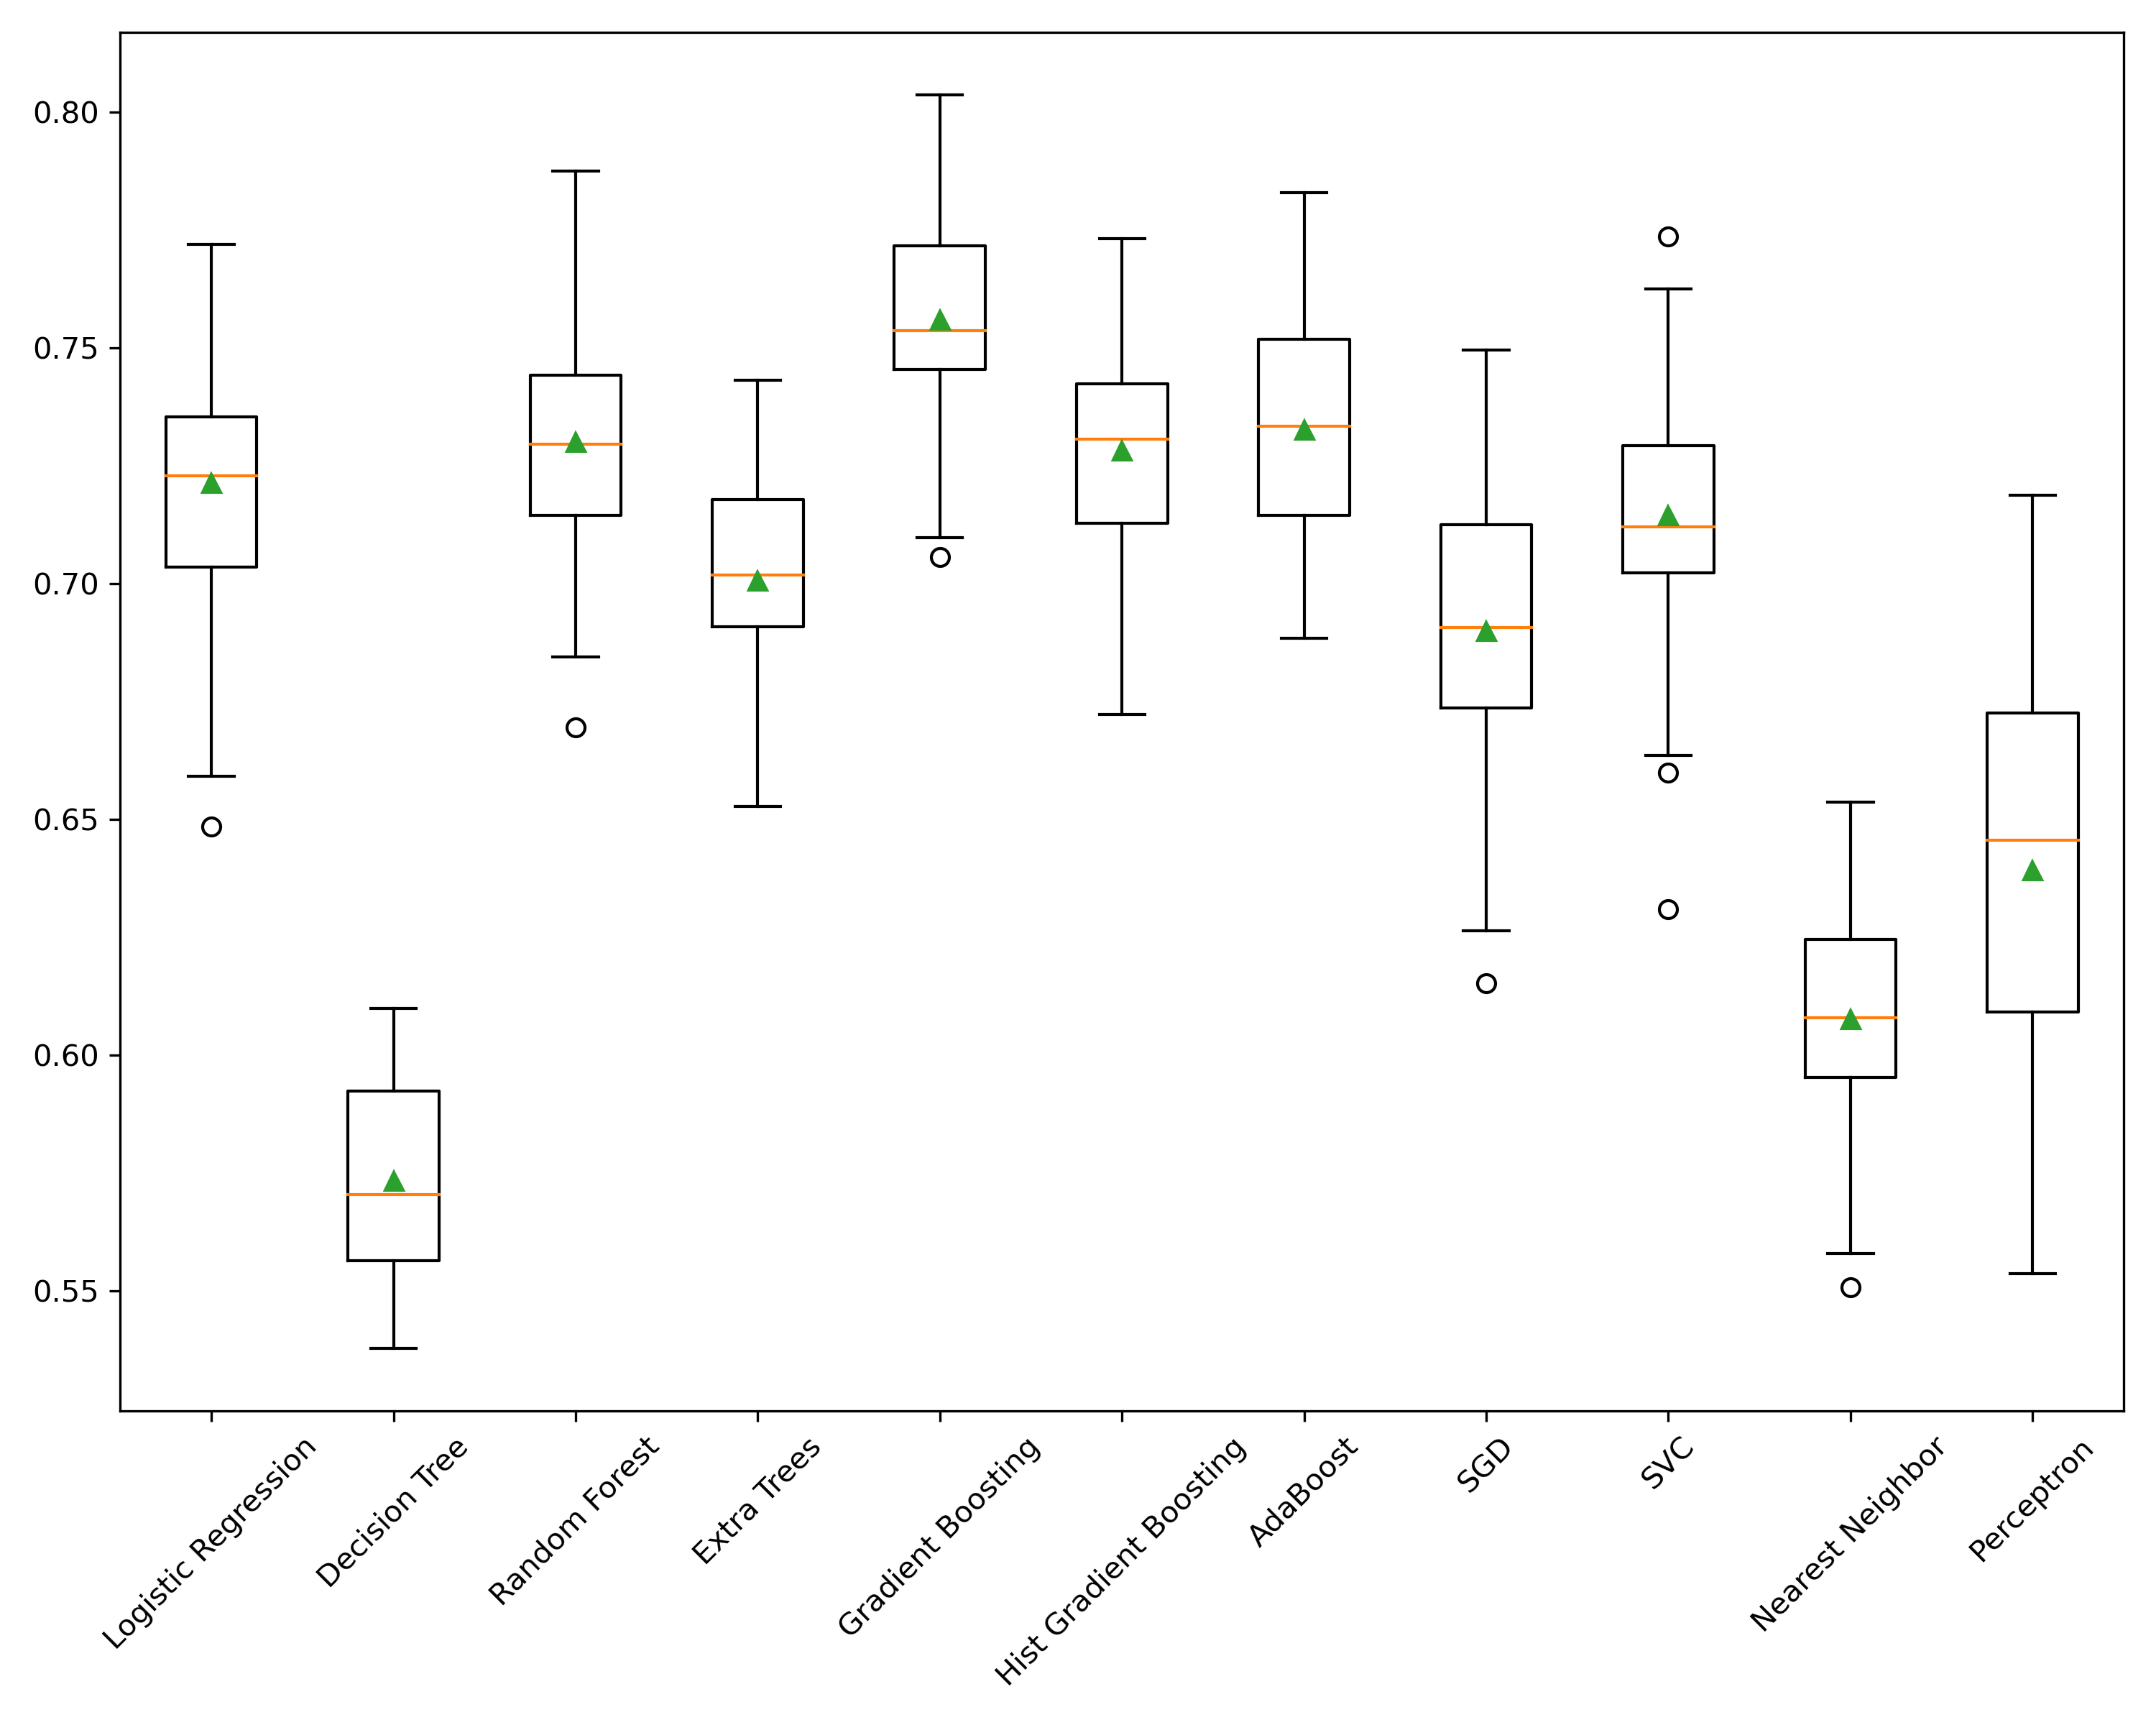
Algorithm Selection
Let's start with the most simple way. In this example, I'll refer to Scikit-Lern's algorithm selection and how they handle imbalanced data. Many of their algorithms support a class_weight parameter which can be set to balanced. For example, RandomForest, LogisticRegression, Perceptron, and SVM support this parameter. According to the documentation:
class_weight{“balanced”, “balanced_subsample”}, dict or list of dicts, default=NoneWeights associated with classes in the form
{class_label: weight}. If not given, all classes are supposed to have weight one. For multi-output problems, a list of dicts can be provided in the same order as the columns of `y'.The "balanced" mode uses the values of
yto automatically adjust weights inversely proportional to class frequencies in the input data asn_samples / (n_classes * np.bincount(y))
If during your model selection phase you find that one of these classifiers performs well, it's quite simple to use this feature of the algorithm to accommodate for
Train-Test Split and Cross-Validation
When data is imbalanced, you need to split your data in a way that preserves the class proportions, also known as a Stratified Split. train_test_split automatically defaults to split data via the stratify=None parameter. To stratify your split, then use your target variable stratify=y.
So what does Stratify mean? According to Wikipedia:
In statistics, stratified sampling is a method of sampling from a population that can be partitioned into subpopulations.
In other words, it’s honoring the sizes of the subpopulations or classes and taking that into account when splitting.
When performing cross-validation for model evaluation, you should use the StratifiedKFold cross-validator. It will ensure that the folds are made by preserving the percentage of samples for each class 2.
Important Note: This step is critical. Without this, you may end up with zero minority class samples in your test.
SMOTE
Synthetic Minority Oversampling Technique (SMOTE) uses a nearest-neighbor approach for generating new minority class samples. The method is applied only to the training dataand then tested on the original, untouched test partition. The method chosen here is first to oversample the minority class making it balanced, and then undersample it to reduce the size and bloat 1.
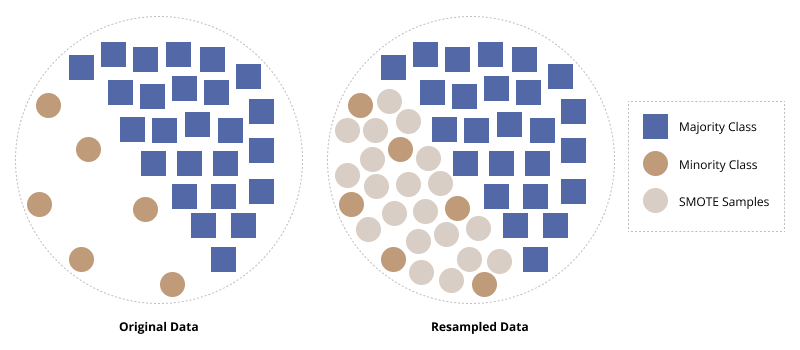
By synthetically generating minority class observations that are similar but not identical to other minority class observations, we can improve the model's performance on the minority class.
The package imblearn contains the SMOTE algorithm and can easily be integrated into SKLearn pipelines.
Important Note: Never perform SMOTE on your test dataset, only on the trainpartition!
Implementation Note: You must import the imblearn pipeline instead of the sklearn pipeline, or it will not work.
 from imblearn.pipeline import Pipeline
from imblearn.over_sampling import SMOTE
from imblearn.under_sampling import RandomUnderSampler

pipeline = Pipeline([('prep',column_trans),
                     ('over', SMOTE(random_state=42)),
                     ('under', RandomUnderSampler(random_state=42)),
                     ('clf', clf)])
More: For more information on utilizing pipelines, check out my post: Using Pipelines in Sci-kit Learn.
Choosing the Right Evaluation Metrics
Finally, choosing the right evaluation metric is critical with imbalanced data. If you’re relying on Accuracy, you’re most likely not going to achieve the results you think you are. Depending on the outcome you’re looking for, you can look at several different metrics such as precision, recall, and F1-score. Please look at my other post: Stop Using Accuracy to Evaluate Your Classification Models.
Conclusion
Imbalanced data is everywhere in real-life applications of machine learning. It’s easy to fall into the trap of overlooking imbalanced data only to find out that not performing the way you think it is. Fortunately, there are several ways to handle this, such as choosing an algorithm that deals with imbalanced data, splitting your data and cross-validating your model in a stratified way, utilizing SMOTE to synthetically generate data, and last but not least, choosing the best evaluation metric for the outcome you desire. Happy model building!
If you liked what you read, subscribe to my newsletter and you will get my cheat sheet on Python, Machine Learning (ML), Natural Language Processing (NLP), SQL, and more. You will receive an email each time a new article is posted.