By
By
What is Looker?
Looker is a Business Intelligence (BI) tool from Google. It's entirely web-based and inherently multi-platform. I've had the pleasure of working with PowerBI, Tableau, SAS, and Others. However, Looker remains my favorite BI platform due to its beautiful presentation layer, powerful LookML modeling language, and its integration with GitHub.
Looker has a wonderful training environment that you can use to learn the basics of the platform. I highly recommend you start there. I'll use the training environment and the sample data provided in this post. Check out Looker Connect.
How About Some Power User Tips?
Over the past couple of years of developing in Looker, I've come across some tips and tricks that might benefit everyone. Some of these are rather simple, but maybe you haven't yet encountered them. Others are true power-user tricks that will take your looker usage to the next level. I'll start with the basic tips and finish with a few of my absolute favorites.
- Table Calculations
- Save as Look for Easy Sharing
- Grouping Dimensions
- CASE statements to clean up Dimensions
- Manually Setting Targets in Single Value Tiles
- Create a Quick Explorer from SQL Runner
Table Calculations
This tip is very simple but has a huge amount of power. As a user of a Looker Explorer, you might want to perform additional calculations on your data that aren't native to the measures provided. The way to accomplish this is through a Table Calculation. Think of a Table Calculation as entering a formula in a cell in Excel. You can grab data from other columns and perform many different operations on them, from simple addition/subtraction/multiplication/division to much more advanced calculations like statistical tests.
In this simple example, I'll find the average revenue per item ordered by dividing two revenue by the order item count. You can choose how to format the data and give it a better name.
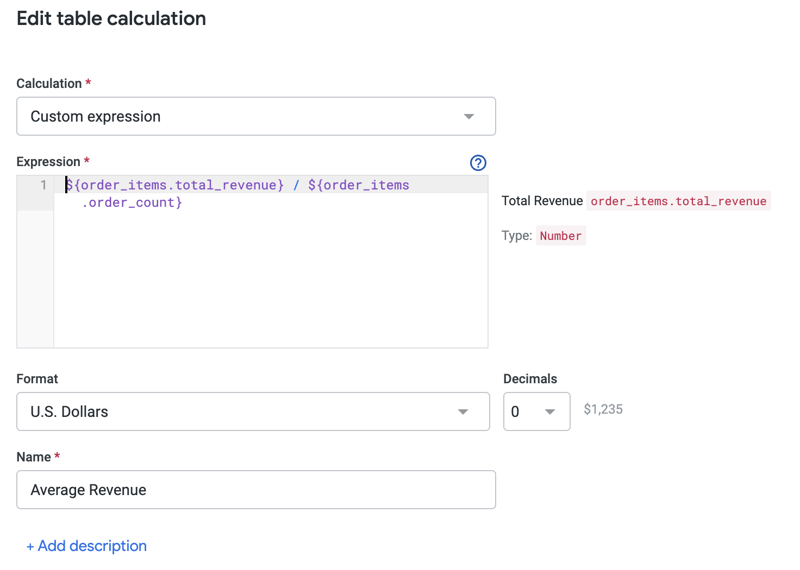
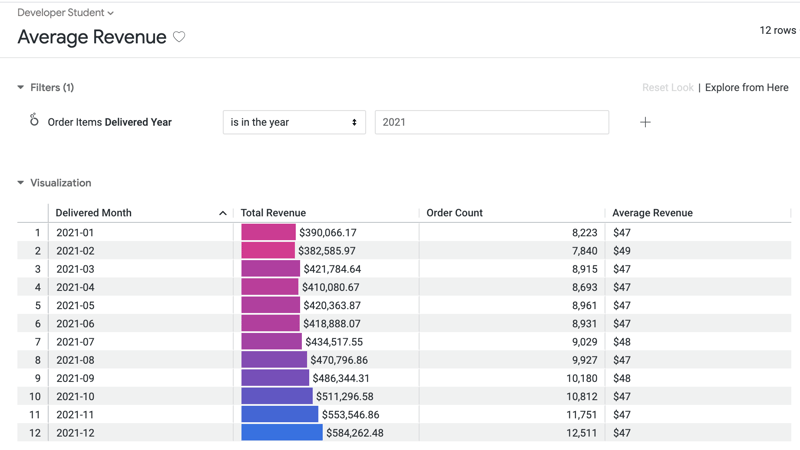
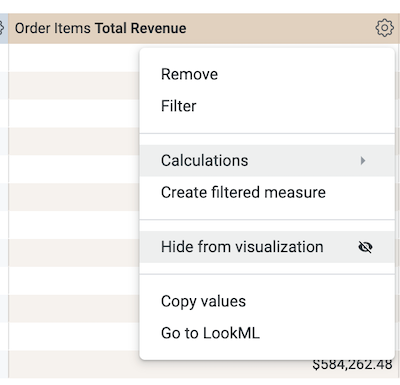
We can see the results of our Table Calculation here. They will show up in green to give you a visual indicator that they're not Dimensions (blue) or Measures (tan).
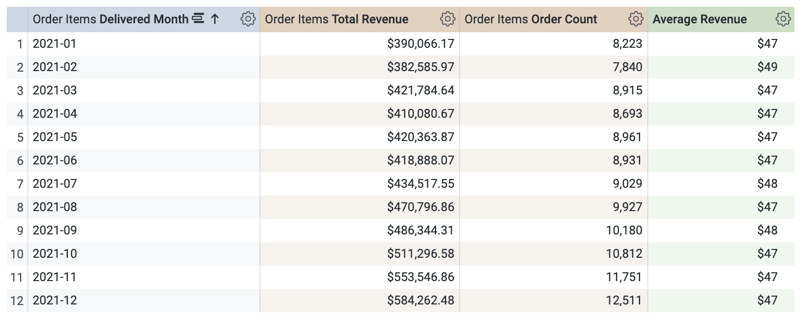
Note: Table calculations only work with data already presented in a column. If you remove one of the measures, the calculation will fail.
Save as Look for Easy Sharing
Another very basic one, but it's worth mentioning. One of the limitations of using Looker early on is that the very powerful Explore feature is only available with a more expensive Analyst tier license. The Explore functionality is how people can self-service their own data analytics, but without that license, they're stuck to only utilizing what's on a dashboard.
However, there is an exception to saving an Explore to a Look! From the gear icon, you select Save > As a Look and then give it a name and location.
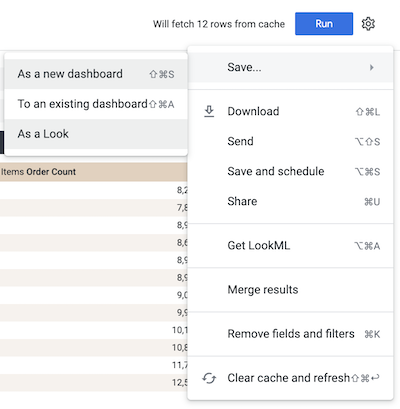
Once saved, you can share these Looks with others, and they can even adjust the Filtersthat you set up to get a small taste of what it's like to Explore on their own.
Grouping Dimensions
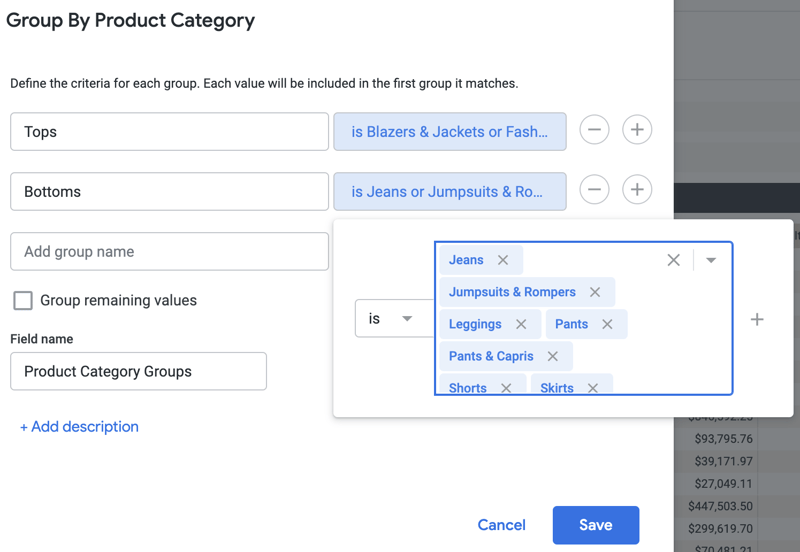
This particular trick took me a while to discover, but now I utilize it all the time. When your data needs categorical information that you want to present the data better, never fear; you can create synthetic categories with the Group option.
First, start by selecting the dimension you want to group. Then, select the Group option from the menu (three vertical dots).
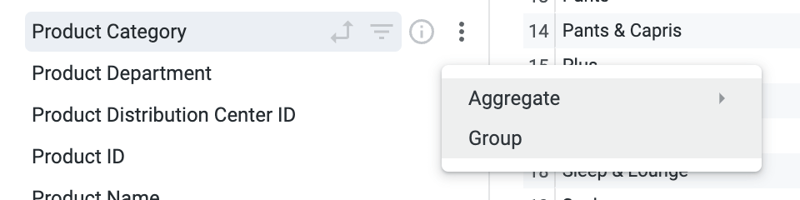
Next, you create the conditions that you want to teach it how to group your data. I'm creating a categorical feature for this retail clothing dataset for Tops, Bottoms, and another catch-all category called Other. (Select the Group remaining values option to create a catch-all category.)
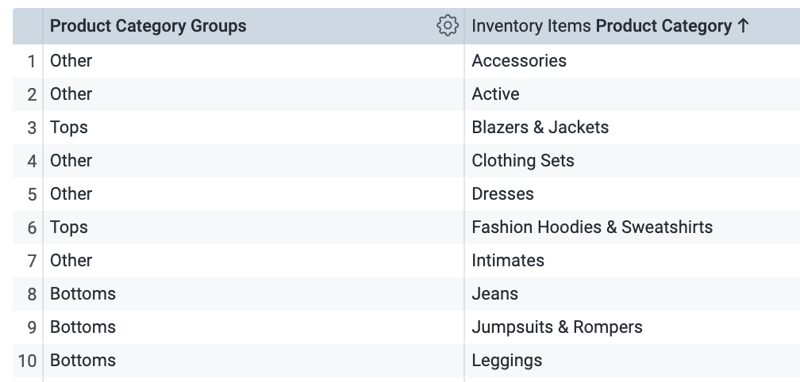
Now we can see our new dimension and how it grouped our data. Super fast and easy.
CASE statements to clean up Dimensions
Welcome to my power-user section! Let's say you wanted to do something similar to the Grouping example above, but you want it more permanent. You can do this by directly utilizing a CASE statement in Explorer's LookML definition. In this situation below, I had two conditions that both mean the same for a failed job. By utilizing this method, I grouped those two into one Failed category. I also used this to clean up the labels and capitalize the first letter of each word.
  dimension:  status{
    label: "Status"
    description: "Status of the job (success, failure, cancelled)."
    type: string
    case: {
      when: {
        sql: ${TABLE}.status='cancelled';;
        label: "Cancelled"
      }
      when: {
        sql: ${TABLE}.status='failure' or
          ${TABLE}.status='failed';;
        label: "Failed"
      }
      when: {
        sql: ${TABLE}.status='success' ;;
        label: "Success"
      }
      else: "Unknown"
    }
  }
Another way I like to utilize this method is to clean up values from a database and turn them into a more human-readable format. For example, I might have a column with values like US, UK, CA. I can use a CASE statement to turn those into United States, United Kingdom, Canada.
Manually Setting Targets in Single Value Tiles
This tip comes as the runner-up to my all-time favorite. One of the basic things we do when setting KPIs goals is picking a target for them. When you have a target you want to hit, you don't just want to see a comparison number to the prior year and see how you are performing against that target! The problem is that you need a way to set a target value for a measure in Looker. I came up with this method which has turned out to work perfectly!
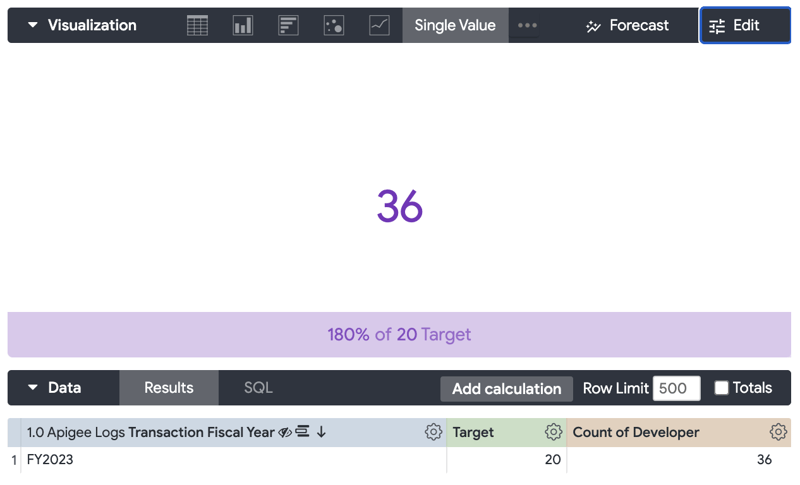
When working with the Single Value visual, you get an option to set a Comparison value. Looker works by displaying the first row of your results as the main value in the Single Value visual, and the second row will be the compare value. Under normal situations, this works by letting you calculate the Month-over-Month or Year-over-Year comparison.
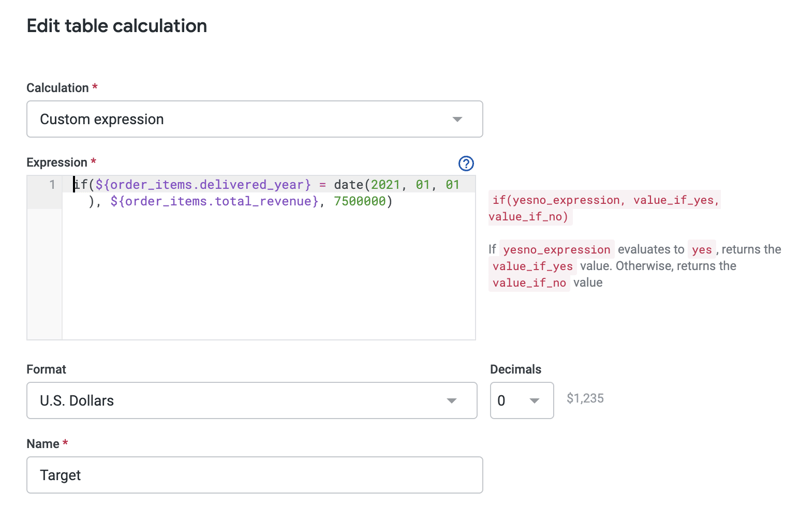
The first step is to create a Table Calculation that will display the actual value for the first row and then a fixed number for the second and subsequent rows. You accomplish this with an If statement that looks for the row value, and my example below uses a very simple hard-coded year.
Note: You could make this much smarter by utilizing the now() function so that your dashboard doesn't need to be adjusted when the year turns over. Bonus points for you if you can make that happen!
Next, set the Comparison value on the visual to Calculate Progress (with Percentage). And that's it!
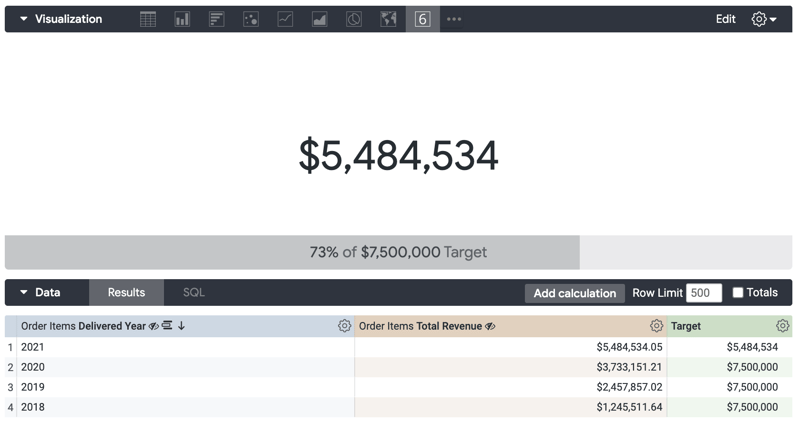
Notice how the Target Table Calculation shows the actual value for the first row and my hard-coded value for the second row.
To make this work, be sure to hide the other columns from the visualization. Do this for each column that isn't the Target column.
Update
I learned a new way to set an even easier target when talking with a colleague this week. Create a table calculation just like before but instead of the if statement, you enter the numeric value of your target directly! Then, make sure you unhide both the value and the target columns. That's it!
Create a Quick Explorer from SQL Runner
Last tip of the day and by far the one that was a game changer for me. The ability to create an Explorer from a Query in the SQL Runner. What makes this so powerful is that you can quickly perform analysis across multiple tables without all of the LookML configurations.
How do I use this? Let's say you have a few massive tables you use all the time in your Data Warehouse. Then you get a set of data from another source and want to join it all together. In my case, I might get some data in the form of a CSV with a list of customers pulled from a different source, and I will upload that data into a temporary table in the Warehouse. Once it's in the Warehouse, I can perform a join with the other tables I need to finish the task. However, because this is temporary, I want to set up only some of the infrastructure to permanently make it appear in Looker. The SQL Runner is the perfect place to make this all happen.
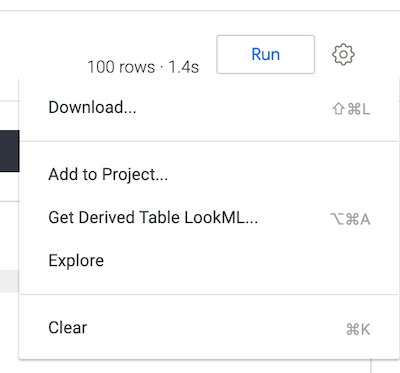
Head over to SQL Runner and build your query, something simple like the one below, or it could even be a massive query built up with Common Table Expressions (CTEs).
SELECT *
FROM `cloud-training-demos.looker_ecomm.order_items` AS order_items
LEFT JOIN `cloud-training-demos.looker_ecomm.users` AS users
ON order_items.user_id = users.id
limit 100
Once your query is built, click the Explore option. You are left with a couple of limitations. It will only have one measure by default (count). If you need some specific measures, you can add them by selecting the field and picking the aggregation (count, sum, average) you need. In most cases, you won't be able to save this to a dashboard either. But you can save a link to Explorer and share it with others. I've saved countless hours utilizing this method. Give it a shot!
Conclusion
There you have it. Six quick looker tips that will help you improve and speed up your analysis. Looker is an incredibly powerful BI tool; these tips will help you get the most out of it. I started with three basic tips Table Calculating, saving Explorers as Looks, and Grouping dimensions. Next, I shared a few more advanced tips. I was first starting by using CASE statements to clean up data. Then I showed you how to set targets in Single Value Tiles manually. Finally, I showed you how to create an Explorer from a query in the SQL Runner. Enjoy and happy building!