By
By
Model Evaluation for Binary Classification
Understanding how to evaluate models is a critical part of any Machine Learning (ML) project. Many times when we're starting with ML or when having conversations with people that aren't as well versed in ML, the term Accuracy is thrown out as a generalization of the model's performance. The problem with talking about the Accuracyof a model is that it specifically refers to a calculation that divides the number of observations it correctly classified vs. the total number in the test set.
While Accuracy is acceptable for model performance when your dataset is perfectly balanced (equal positive and negative classes), the reality is that this is rarely the case. There are methods to deal with imbalanced data, which I'll talk about in a later post, but for now, let's understand how to interpret the results of a model's performance properly.
More: For information on dealing with imbalanced data, check out my other post: Working with Imbalanced Data.
Interpreting a Confusion Matrix
After a model is trained and tested on data (Scikit-Learn has a great write-up of this process1), you can generate a Confusion Matrix to give a view of how observations the model misclassified. A Confusion Matrix is a 2x2 table (for binary classification) that plots the actual values vs. the predicted values on its axes. Once you understand how to interpret it, it is easy and intuitive to see your model's performance.
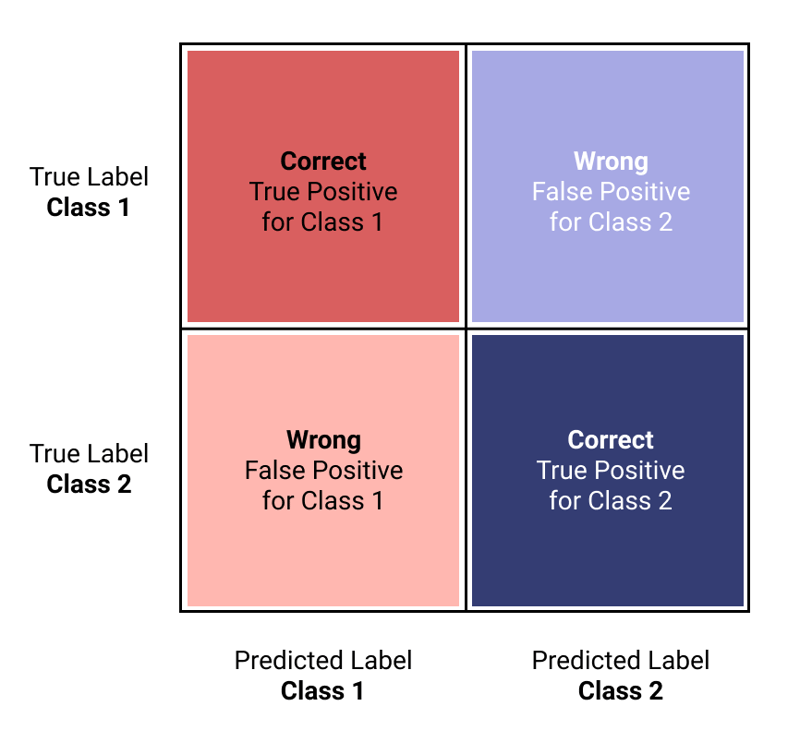
Image by Author.
The matrix shows correctly classified observations in the top left and bottom right quadrants, while misclassified are in the other corners. Thinking about these as rows or columns independently helps you interpret each class.
See the Scikit-Learn documentation for how to display a Confusion Matrix.
Evaluation Metrics
- Accuracy: This is the percentage of observations that the model correctly predicted across both classes. Be very careful with imbalanced data. You can have very high accuracy, but the performance of the minority class can be horrible.
- Precision: Tells you how reliable the prediction is for the class. e.g., when the precision score is high, and the model predicts the class, you can trust it is correct.
- Recall: Tells you how well the model can predict the class. A high recall with low Precision means that it is performing well in the class but may include other classes in the results.
- F1 Score: Calculates the harmonic mean of Precision and Recall combining them into a single metric.
The following image is the best way that I've seen to illustrate how each calculation is performed. It can also help you, once you understand what you're trying to optimize for, which type of metric you should use.
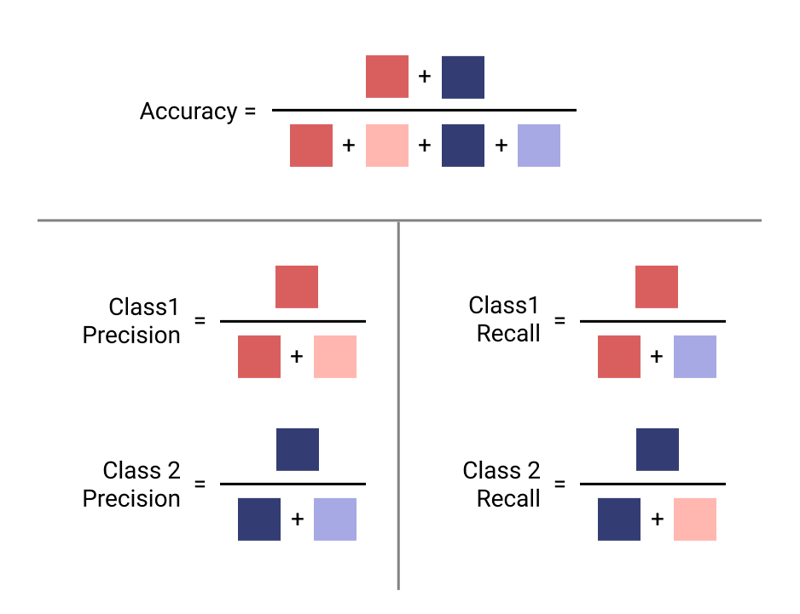
Image by Author.
For example, if you're looking to minimize False Positives for Class 1, then Class 1 Precision is the right metric for you (Dark Orange and Light Orange in the Image).
Note: Precision is the relationship of the column in the matrix, and recall is the row in the matrix.
Optimize for the Outcome You Want
A critical part of picking the right evaluation metric is to decide what is the most important outcome you want. I think of this broken down into three things:
- Minimize False Positives: A use case for this might be a spam filter. Ideally, you never want to mark a real message as spam and have it filed into a spam folder. The potential for a user to miss an important message is high; therefore, you want to reduce false positives and choose a model with high Precision.
- Minimize False Negatives: The best example here for me is medical screening. It would be incredibly bad if the algorithm had false negatives with the patient, but they were sick. It would be best to flag potential issues and have an expert follow up. In this case, you want to focus on a high Recall.
- Both: If your use case doesn't have a bias to one or the other, then choose F1 for a balanced metric for both Precision and Recall.
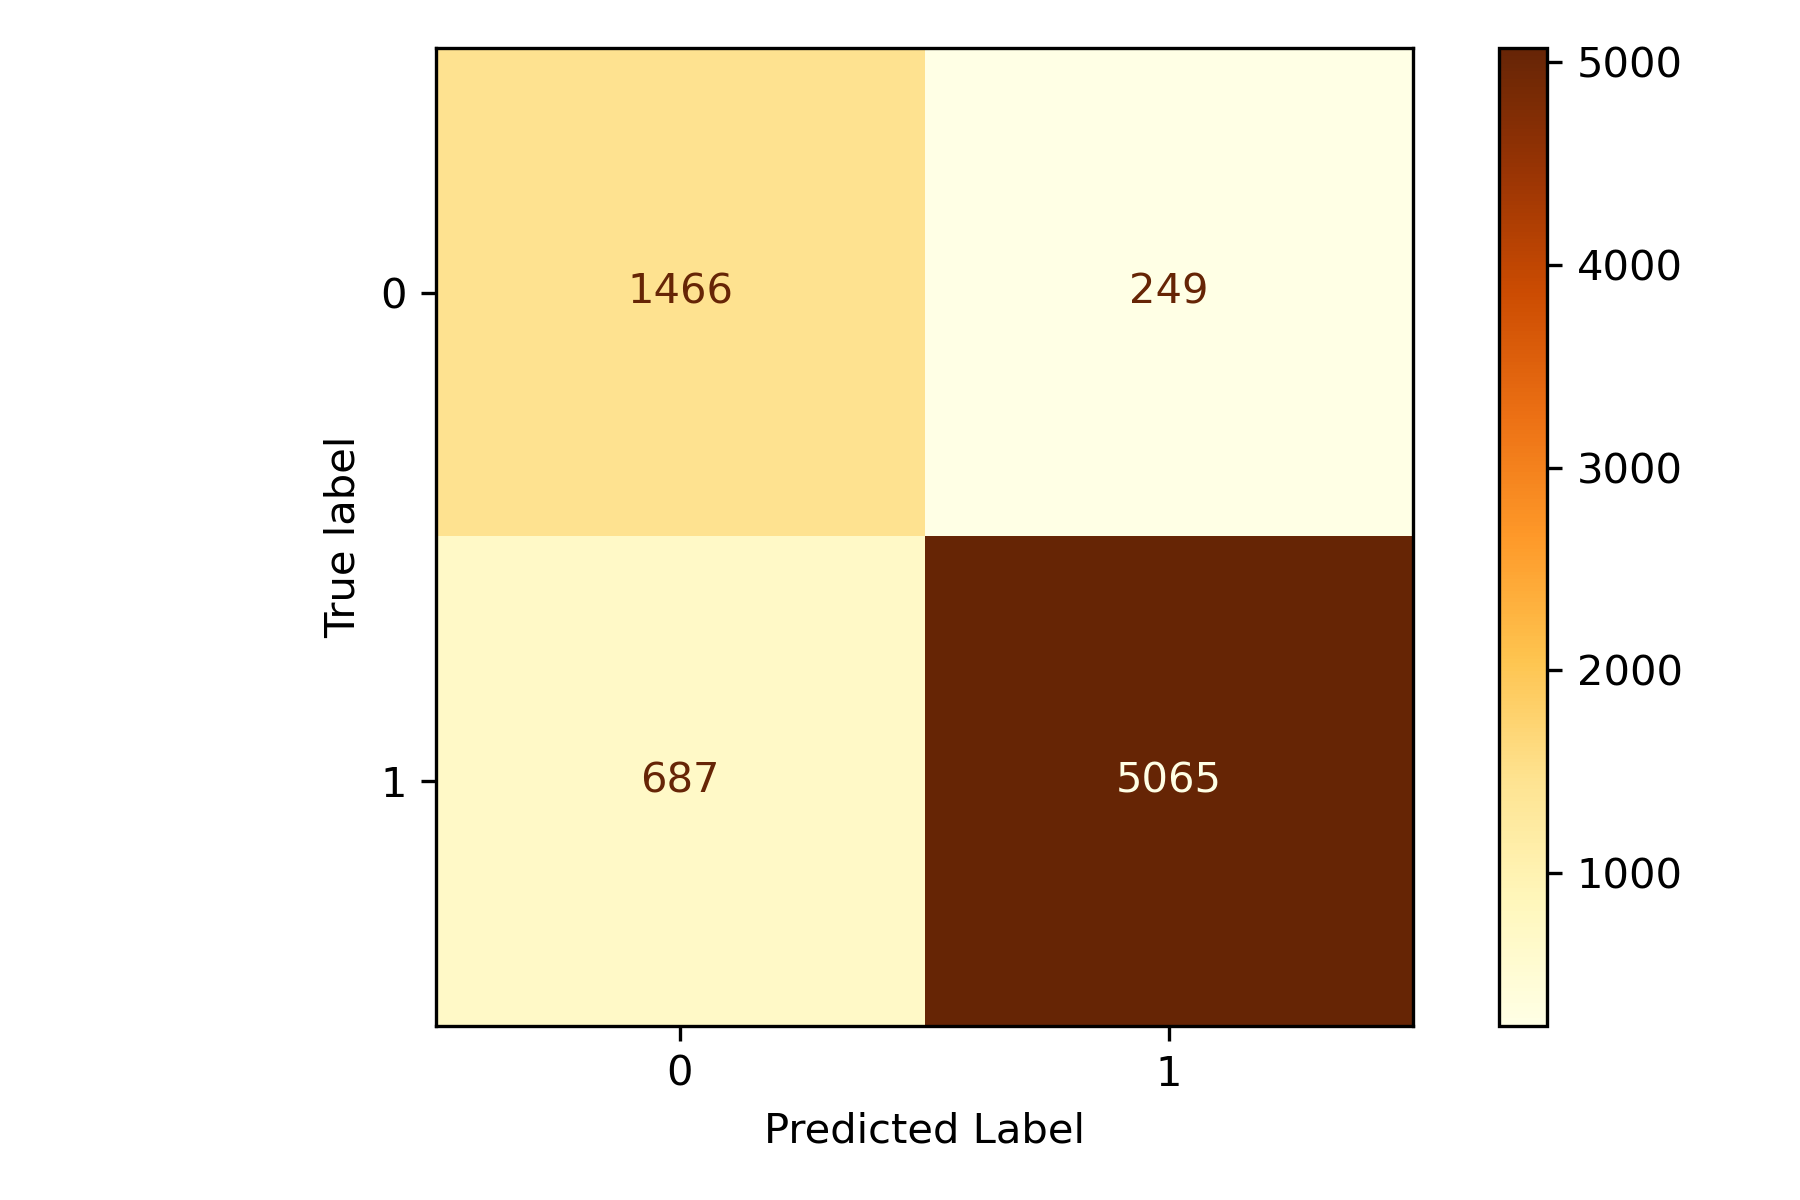
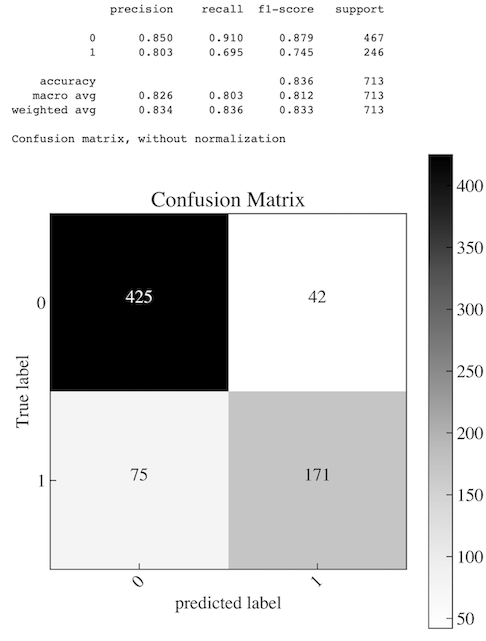
Confustion Matrix in Practice
Here is a recent Confusion Matrix from a Random Forest algorithm I trained. My objective was to predict when a user would convert from a trial account to a paid account for a SaaS offering. This example is created from Scikit-Learn and is also showing the various evaluation metrics above. In my case, the positive class (1) was those that converted to paid, and the negative class was for those that failed to convert. Take a look for yourself and see how you interpret the results.
Code
To output the above confusion matrix, you can utilize the following code.
 from sklearn.metrics import classification_report
from sklearn.metrics import ConfusionMatrixDisplay

# print classification report
print(classification_report(y_test, y_pred, digits=3))

# show confusion matrix
ConfusionMatrixDisplay.from_predictions(y_test,
                                        y_pred,
                                        cmap=plt.cm.Blues)
plt.show()
See the Scikit-Learn documentation for more information on displaying a Confusion Matrix.
Conclusion
A confusion matrix is a powerful tool in your toolbox for evaluating both binary and multi-class classification models’ performance. The trick, however, is not just to understand how to interpret the matrix; it is to understand the correct evaluation metric to use truly. Remember not to default to accuracy; there is an appropriate metric for your desired outcome! Enjoy!