By
By
What is Sentiment Analysis?
Sentiment analysis helps understand the tone of text data, positive, negative, or neutral. Capturing sentiment can help organizations better understand the Voice of Customer (VOC) and even direct product development to improve functionality. Frequently, sentiment analysis is lexicon and rule-based, meaning it performs a lookup on words tagged by humans as positive, negative, or neutral. There are more advanced models available such as BERT, which was open-sourced by Google in 2018 This post will cover the more traditional lexicon-based approach; we'll take a look at the deep learning models later.
You need to be familiar with new terms to interpret the results. They are simple concepts but understanding them upfront will help you follow along better.
- Polarity: A value expressing the degree of emotion of a sentence from negative to positive. A value within the range [-1.0, 1.0] (negative sentiment => -1.0, neutral => 0.0, positive sentiment => 1.0)
- Subjectivity: A subjective sentence expresses personal feelings, views, or beliefs. The subjectivity is a value within the range [0.0, 1.0] where 0.0 is very objective, and 1.0 is subjective.
Twitter Data
For this example, we're going to use data extracted from Twitter. Twitter is an excellent source for VOC analysis. You can search for a product name, a hashtag, mentions, or a company name. For Python, we can use the Tweepy wrapper of the Twitter API.
In searching for great examples of data that would be highly positive or highly negative, I just happened to be writing this and downloading data the moment the Ghislaine Maxwell trial verdict was being read and figured that would be a great place to start for negative. Who would be the opposite, where nearly all tweets would be positive? I chose Taylor Swift.
I won't cover the actual code I used to extract the Tweets, but all of it is available here if you would like to try this on your own: Tweet Extraction Notebook
As usual, let's import the libraries we'll be using and import our data to get started.
 import pandas as pd
from textblob import TextBlob

from vaderSentiment.vaderSentiment import SentimentIntensityAnalyzer

import seaborn as sns
import matplotlib.pyplot as plt
 swift = pd.read_pickle('swift.pkl')
maxwell = pd.read_pickle('maxwell.pkl')
Sentiment Analysis with TexBlob
TexBlob is a package I like to use for quick NLP projects. It's a simple Python API that supports common tasks like sentiment analysis. It contains two different sentiment analyzers. The first is called PatternAnalyzer, and the other is NLTKs NaiveBayesAnalyzer, which is trained on a movie reviews corpus.
Getting the polarity (or subjectivity) score from TextBlob is simple. We can use Panda's apply method to get the `sentiment.polarity for each tweet.
 # Apply the Polarity Scoring from TextBlob
swift['blob'] = swift['text'].apply(lambda x: TextBlob(x).sentiment.polarity)
swift.head()
  TWEET POLARITY
0 RT @TSwiftFTC: 🥇 According to @HITSDD, Taylor ... 1.000000
1 RT @taylorr_media: Taylor Swift - All Too Well...  0.000000
2 Taylor Swift and Ed Sheeran music mainly. And ...  0.166667
3 RT @soitgoes: Taylor Swift didn't write:...        0.200000
4 Suporte list: Nial Horan, Demi Lovato, Taylor ...  0.000000
As simple as that, we have our polarity scores. We can see in the above examples that we have some ranging from neutral to the max positive value of 1.0. Quite often, your text will have a neutral sentiment. Since neutral tweets do not add any information for the analysis, we can remove them and leave only those positive and negative.
 # Get rid of neutral sentiment
filter = swift['blob'] != 0
swift = swift[filter]
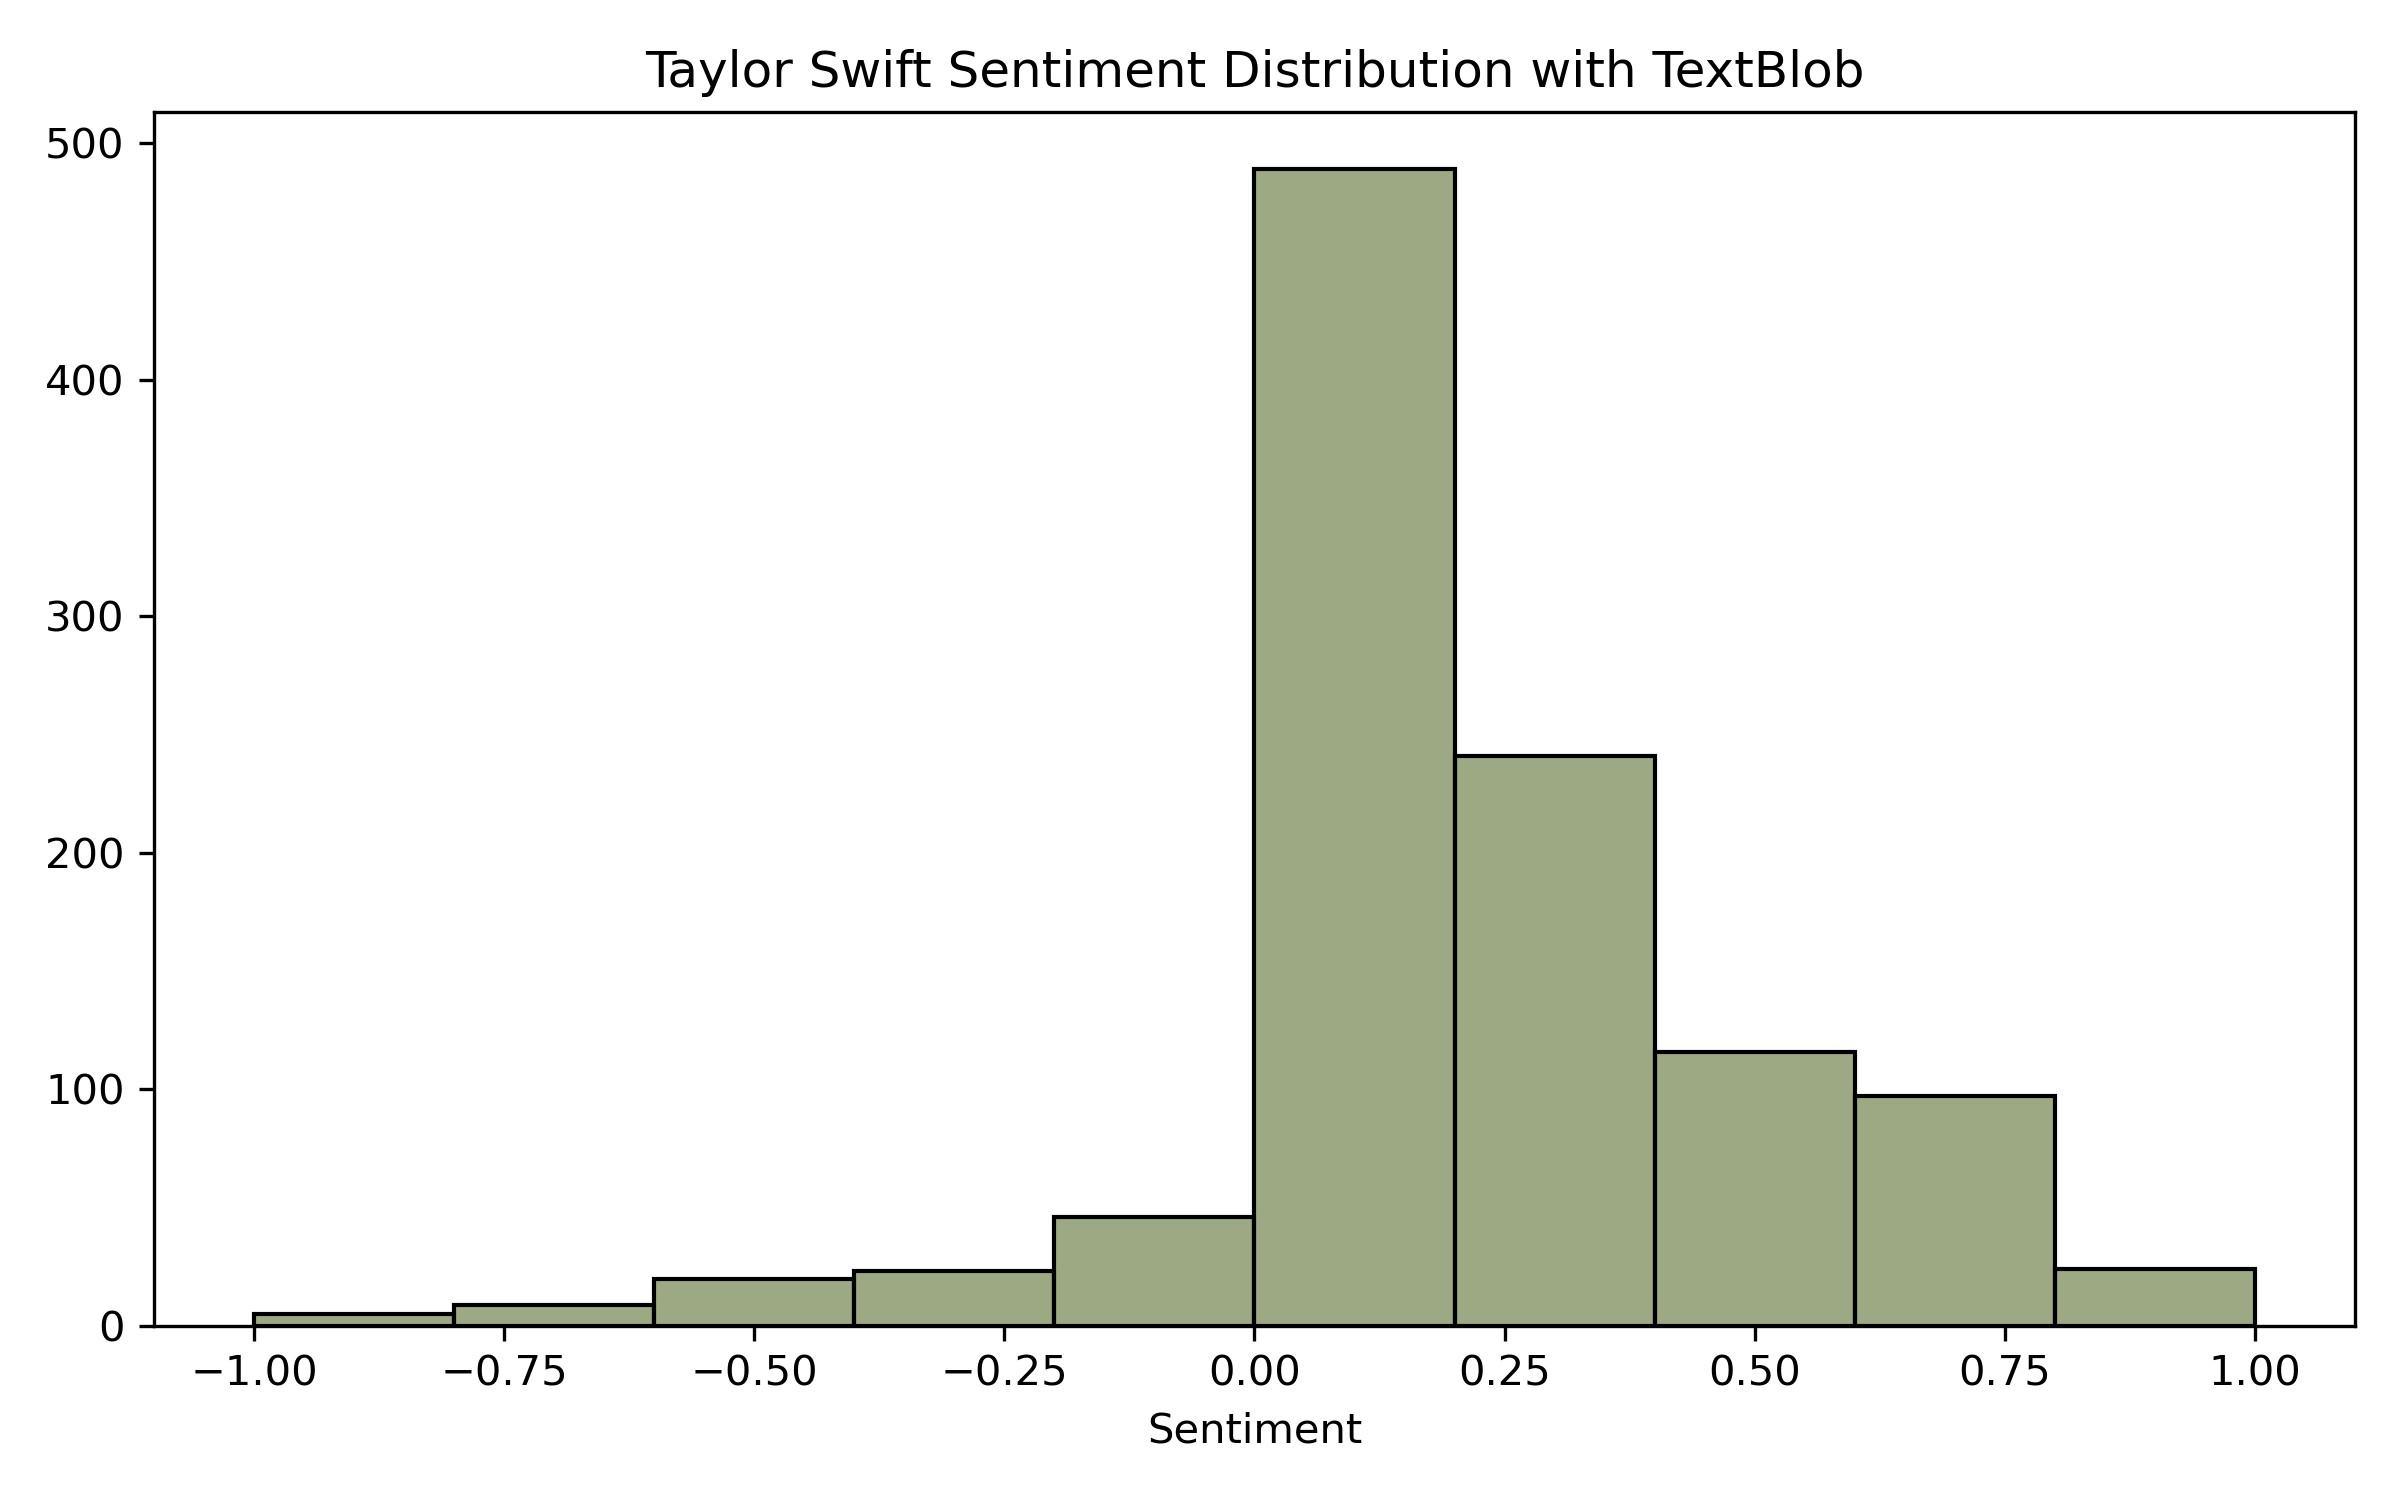
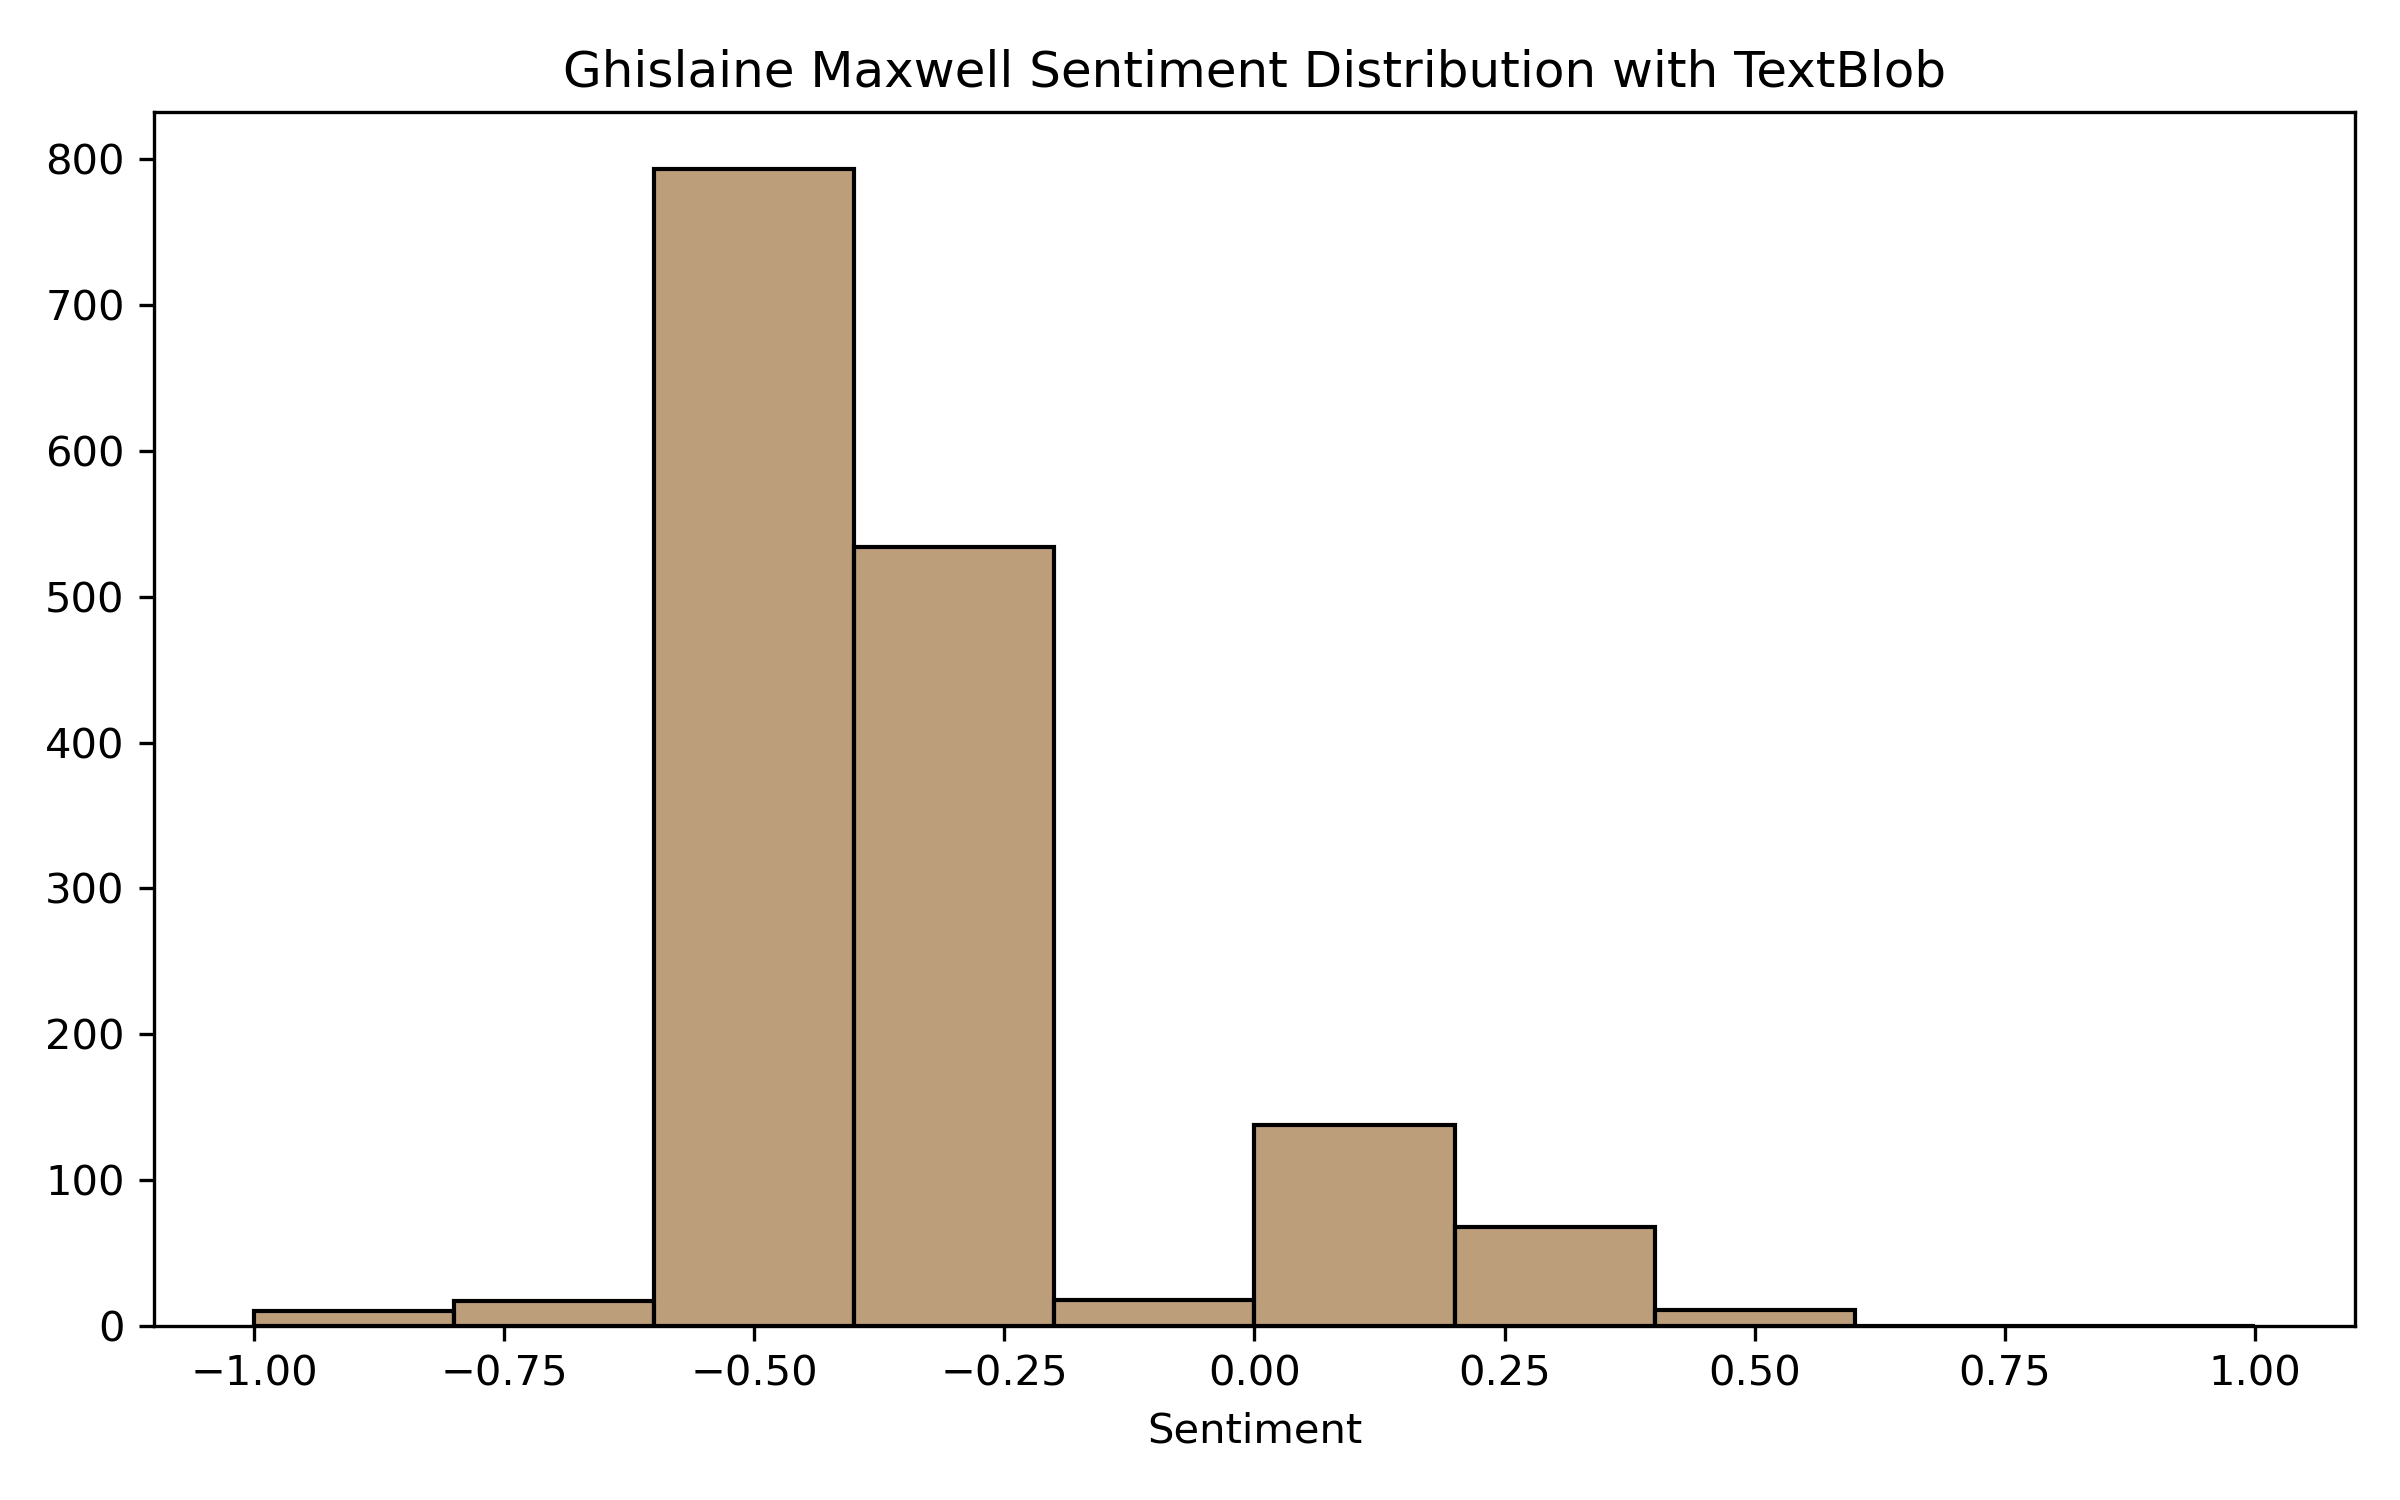
And next plot our results. I'm using the histplot from Seaborn. Histograms are ideal for visualizing polarity scores since they can nicely be binned into the range of -1.0 to 1.0.
 sns.histplot(swift, x='blob', color="#7C8C58", bins=10)
plt.title("Taylor Swift Sentiment Distribution with TextBlob")
plt.xlabel("Sentiment")
plt.ylabel("")
Below, you can see how the Taylor Swift tweets are mostly positive, while the Maxwell tweets are mostly negative.
Social Media Sentiment Analysis with Vader
TextBlob is not optimized for shorter text or social media posts. It's better suited for longer, clean strings written in common language patterns. However, tools tuned explicitly to social media have emerged that understand how to deal with the language patterns used in social media. One such is VADER (Valence Aware Dictionary and sEntiment Reasoner) library. Some of the things VADER handles specifically for social media are:
- Booster Words: Words that increase the sentiment like great or love
- ALL CAPS: Words that are all caps are often used to amplify emotion (GREAT)
- Punctuation: Marks such as ! or !!! will increase the sentiment
- Slang: Words such as SUX or BFF are interpreted correctly
- Emoji: UTF-8 encoded emojis are handled correctly
Note: strings mustn't be cleaned like you normally might with other NLP methods. There is much context that VADER will take away from the unprocessed text.
Before we jump into our Twitter data, let's take a look at how a couple of strings containing only emoji are processed.
positive = "💕 😁 🎉"
negative = "💔 😬 🙁"
 {'neg': 0.0, 'neu': 0.375, 'pos': 0.625, 'compound': 0.875}
{'neg': 0.514, 'neu': 0.203, 'pos': 0.284, 'compound': -0.3415}
The two strings would have returned 0.0 with TextBlob, with VADER they show compound scores that appear to be in line with the emotion that the emojis represent.
Let's do the same process as above but utilize the VADER library. We'll use the same apply method on the Data Frame.
# Add the polarity scores
swift['vader'] = swift['text'].apply(lambda x: sid.polarity_scores(x))
{'neg': 0.0, 'neu': 0.793, 'pos': 0.207, 'compound': 0.7184}
The resulting column is actually a dictionary of different key-value pairs. The key-value that represents the TextBlob sentiment is the one called compound. We can extract it with the following function applied to our dataframe:
# Extract only the compound score value
swift['compound'] = swift['vader'].apply(lambda score_dict: score_dict['compound'])
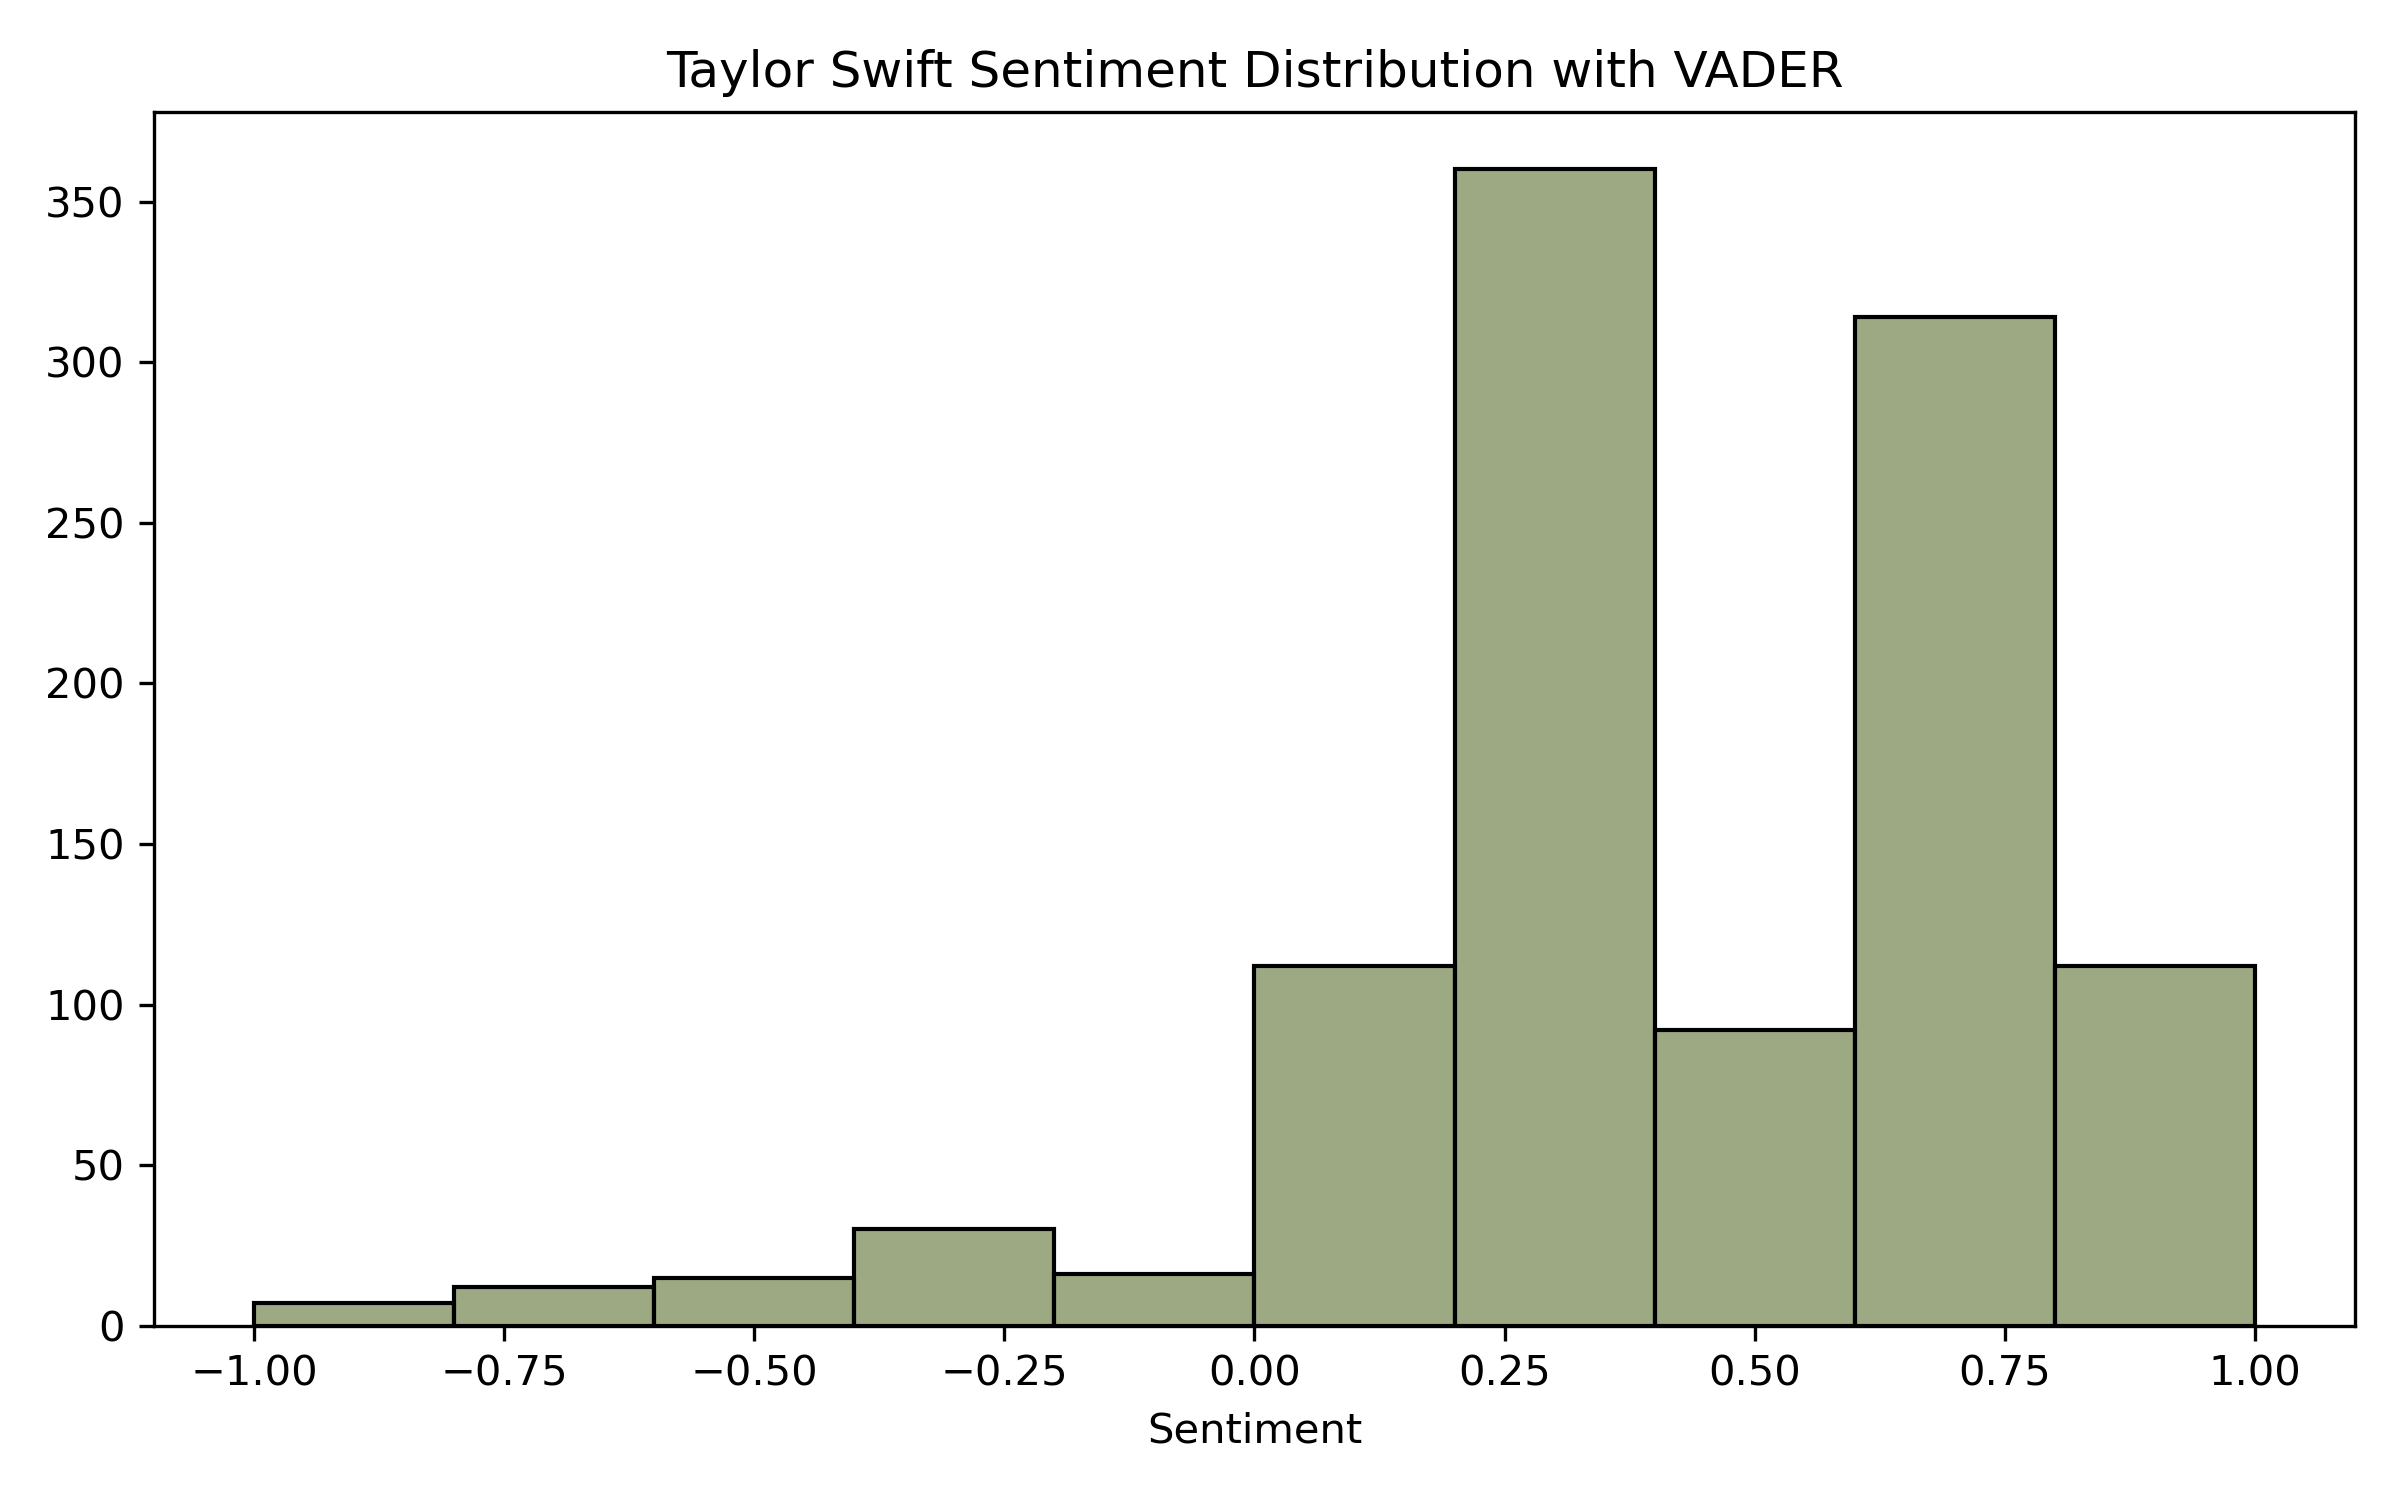
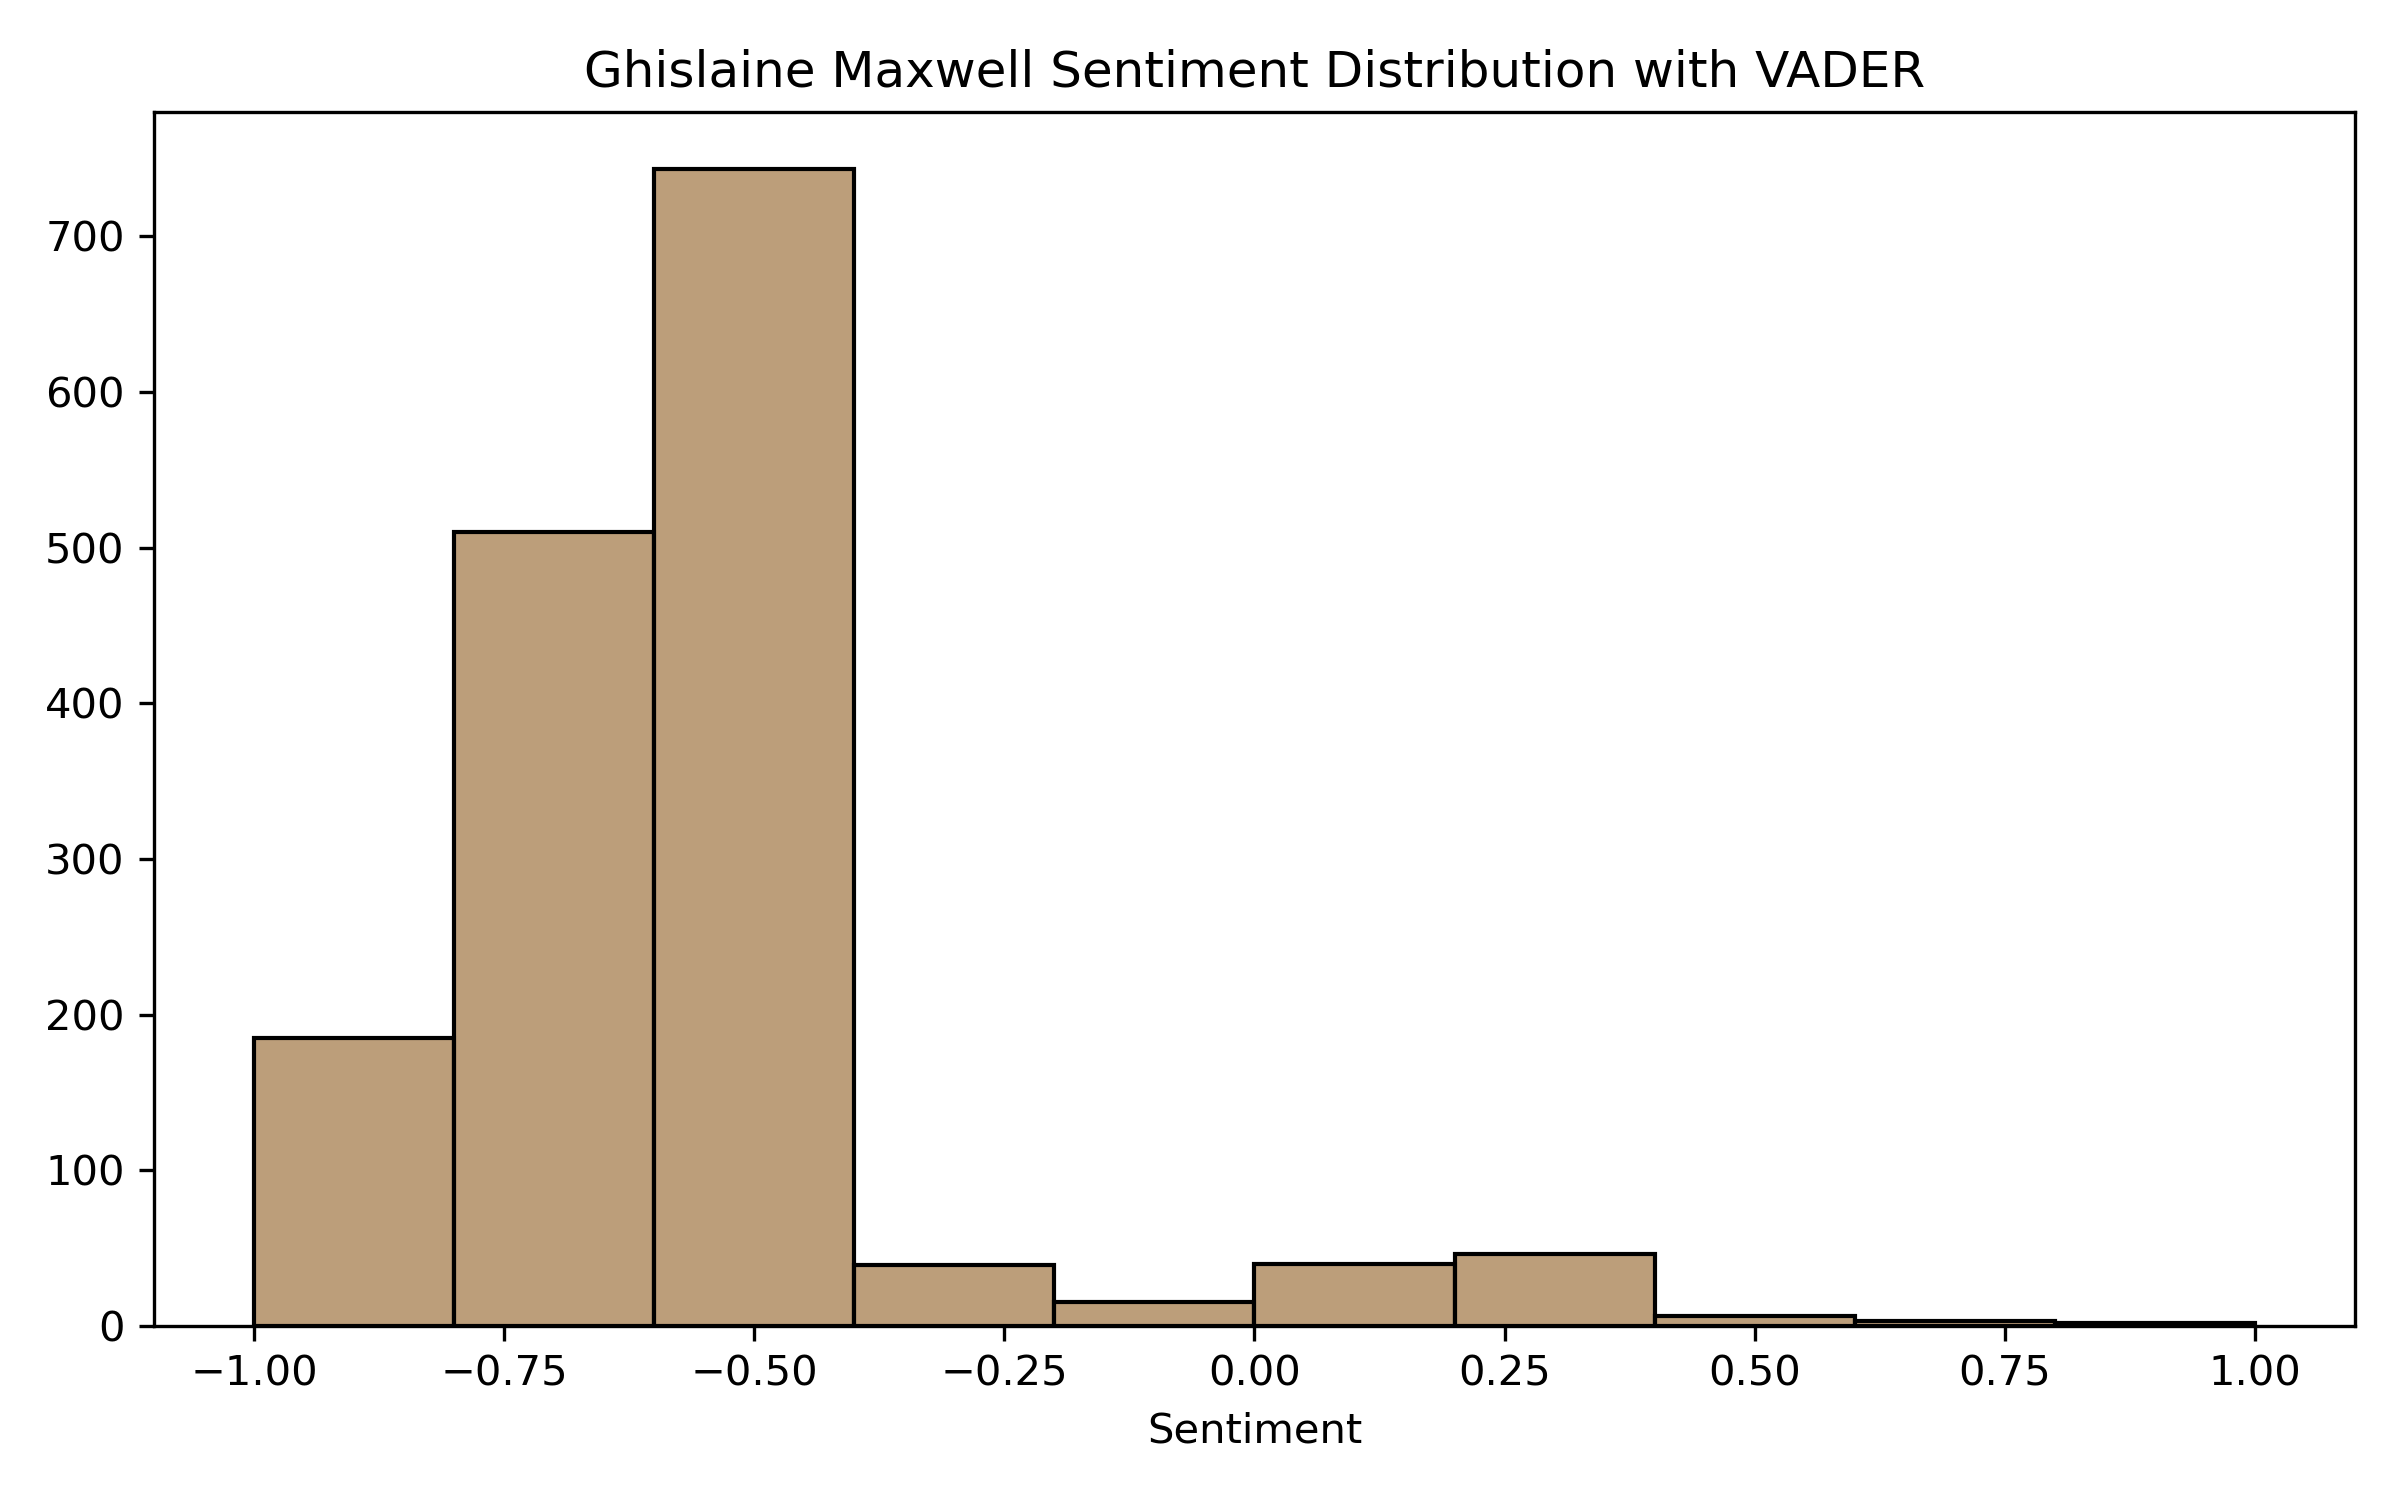
After plotting our results again, we can see that VADER better represents the sentiment. Scores for Swift are more positively biased, and Maxwell is more negatively biased. VADER captures more emotion than TextBlob in the Tweets, whether emojis or other common ways people emphasize their feelings.
Conclusion
There you have it! Voice of Customer analysis of sentiment on Social Media data. This post is just the start of what you can do and how you might leverage this information; however, it's a powerful tool in your toolbox to understand your customers and their emotions better. The full code for Twitter data extraction and Sentiment analysis is available on GitHub